Key Statistics That Will Define National League Teams in 2026
As MLB teams prepare for the 2026 season, certain statistics from 2025 reveal critical areas that will determine success or failure. From bullpen struggles to offensive deficiencies, each National League team faces specific challenges that must be addressed. This analysis examines the one key number for all 15 NL squads that could make or break their upcoming campaign, providing insights into roster construction, player development, and strategic priorities for the new year.
As the MLB offseason progresses and teams finalize their rosters for 2026, certain statistics from the 2025 season stand out as potential predictors of future success or failure. While free agent signings and trade rumors dominate headlines, these cold, hard numbers reveal fundamental weaknesses and strengths that will define each National League team's fortunes in the coming year. Let's examine the one key statistic for all 15 NL squads that could make or break their 2026 campaigns.
Arizona Diamondbacks: 17 Different Pitchers Recorded Saves
The Diamondbacks' bullpen instability reached historic proportions in 2025, with 17 different pitchers recording saves—a new MLB record surpassing the previous mark of 14 held by the 2021 Rays and 2024 Dodgers. This wasn't by design but rather a result of injuries and ineffectiveness. A.J. Puk began the season as closer but got injured after just eight appearances, Justin Martinez earned five saves before injuring his elbow, and Shelby Miller recorded 10 saves before being traded to Milwaukee. The bullpen finished 27th in ERA and 29th in win probability added by relievers.
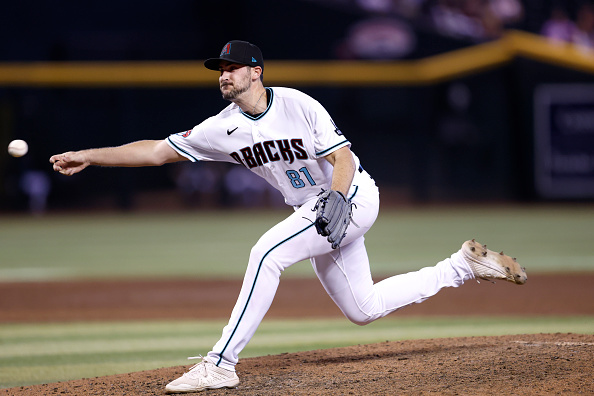
General manager Mike Hazen acknowledged the problem bluntly during winter meetings, stating the Diamondbacks need pitching. After missing the playoffs despite leading the majors in runs in 2024 and posting another solid offensive season in 2025, Arizona's window of contention appears to be closing. The team invested $337.5 million in starters Eduardo Rodriguez, Jordan Montgomery, and Corbin Burnes, but those pitchers accumulated just 1.1 WAR over five combined seasons, with Burnes likely to miss most of 2026. Settling on a reliable closer and overhauling the bullpen must be priorities for Arizona to return to contention.
Atlanta Braves: 38 Runs Created by Shortstops
Braves shortstops created just 38 runs via FanGraphs' wOBA formula in 2025, hitting a collective .222/.281/.268 with only 18 extra-base hits. This represented the lowest run creation by any position in the majors and the second-lowest shortstop production over the past five seasons. Only Tigers shortstops in 2024 (37 runs created) were less productive. The Braves have addressed this deficiency by signing Ha-Seong Kim to a one-year contract after claiming him off waivers from Tampa Bay late last season.
Kim's best seasons came with San Diego in 2022-2023, where he posted back-to-back 5-WAR campaigns with excellent defense and above-average on-base skills. However, his performance declined in 2024 before a labrum tear, and he didn't excel in 48 games with Atlanta in 2025. If Kim can return to his 2024 form (.233/.330/.370), that would represent approximately a 30-run improvement—worth about three additional wins for the Braves.
Chicago Cubs: 39.1 Position-Player WAR
The Cubs led all MLB teams in position-player WAR according to Baseball Reference with 39.1—significantly ahead of the second-place Yankees at 31.8. FanGraphs ranked Chicago third at 31.1 WAR, but regardless of the metric, the Cubs' position group had an exceptional 2025 season. The question for 2026 is whether they can maintain this level of performance while addressing pitching needs.

Chicago will lose Kyle Tucker in free agency after he contributed 4.6 WAR despite second-half injuries. Pete Crow-Armstrong (6.0 WAR with a .287 OBP) and Nico Hoerner (6.2 WAR with just seven home runs) delivered extraordinary value. Crow-Armstrong became just the second player ever to post a 6-WAR season with an OBP under .300, joining Kevin Kiermaier in 2015. Hoerner was the first player since 2014 to achieve 6 WAR with single-digit home runs. Both players may regress in 2026, making their continued performance as vital to Chicago's division hopes as any pitching additions.
Cincinnati Reds: 51 Home Runs from Outfielders
Despite playing in the second-best home run park according to Statcast metrics, Reds outfielders hit just 51 home runs in 2025, ranking 21st in the majors. Their outfield OPS ranked 20th overall. Cincinnati's playoff appearance—their first in a full season since 2013—came primarily from strong starting pitching, but the lack of outfield power represents a significant limitation.
The Reds pursued Kyle Schwarber in free agency, reportedly viewing the Ohio native as a potential ticket-seller, but that pursuit appears to have been a one-off effort. Noelvi Marte moved to the outfield in the second half and has power potential but needs to improve his strike-zone control. Other outfielders on the roster don't project as 20-homer hitters. As a team, Cincinnati tied for last in average exit velocity, suggesting the power deficiency isn't easily fixed through swing adjustments alone. Trading pitching for hitting may be necessary to address this fundamental offensive weakness.
Colorado Rockies: 119 Losses
The Rockies tied for the third-most losses in a season since 1900 with 119 defeats in 2025. Since 2019, they lead MLB in losses with 31 more than the Pirates. New president of baseball operations Paul DePodesta (formerly with the Cleveland Browns) and general manager Josh Byrnes (formerly with the Dodgers) face a monumental rebuilding task.
Historical data offers some perspective: Since 2000, 18 teams have lost at least 106 games in a season. Excluding the 2019 Tigers and Orioles (due to the COVID-shortened 2020 season), the other 16 teams improved by an average of 14 wins the following season. That would bring Colorado to approximately 57 wins in 2026—a modest but realistic improvement target for a franchise that has been MLB's worst over the past six seasons.
Conclusion: Numbers Tell the Story
These statistics reveal fundamental truths about each National League team's roster construction, player development, and strategic direction. From bullpen instability in Arizona to power deficiencies in Cincinnati and historic losing in Colorado, each number represents a specific challenge that must be addressed for success in 2026. As teams continue their offseason preparations, these metrics should guide decision-making and priority-setting for the upcoming campaign.