Post-Holiday Market Analysis: Stocks Flat as Santa Claus Rally Begins
Stock markets opened quietly on the Friday after Christmas, with major indices showing minimal movement as trading volumes remained thin. This session falls within the historically significant 'Santa Claus Rally' period, a seven-day stretch that has traditionally delivered above-average returns for investors. While the S&P 500, Dow Jones, and Nasdaq showed slight declines, precious metals like gold and silver continued their upward trajectory, reflecting ongoing investor interest in safe-haven assets. The market's current stability follows a strong year of gains, supported by deregulatory policies and optimism around artificial intelligence's impact on corporate profits.
Financial markets experienced a subdued opening on the Friday following Christmas, with major stock indices showing minimal movement in what analysts characterize as typical post-holiday trading. As investors returned from the Christmas break, trading volumes remained thin, contributing to the flat performance across key market benchmarks. This particular session holds additional significance as it falls within the historical window known as the 'Santa Claus Rally,' a period that has consistently captured the attention of market technicians and investors alike for its tendency to deliver positive returns.
Market Performance and Key Indices
As of midday trading on Friday, the S&P 500 index showed a slight decline of 8 points, representing a 0.1% decrease to 6,923. The Dow Jones Industrial Average experienced a slightly larger drop of 0.2%, while the technology-heavy Nasdaq composite was down less than 0.1%. These marginal movements reflect the characteristic thin trading volumes that typically follow major holidays, when many market participants remain away from their desks. The quiet trading environment often leads to reduced liquidity and less dramatic price swings, creating conditions where even modest trading activity can have disproportionate effects on index levels.
The Santa Claus Rally Phenomenon
The current trading period falls within what market technicians identify as the Santa Claus Rally, a historically significant seven-day stretch for equity markets. This period, which spans the final five trading days of December and the first two trading days of January, was first identified by market technician Yale Hirsch in 1972. For the current year, this means the rally period began on December 24 and will conclude on January 5. Historical data reveals a compelling pattern: since 1950, the S&P 500 has averaged a 1.3% return during this specific seven-day window, with positive results occurring approximately 78% of the time.

Adam Turnquist, chief technical strategist at LPL Financial, highlighted the significance of this pattern in a December 23 research note, noting that "for comparison, the market's typical seven-day average return is just 0.3%, with a positivity rate of 58%." This substantial difference in both average returns and frequency of positive outcomes makes the Santa Claus Rally one of the most consistently reliable seasonal patterns in equity market history. The phenomenon has persisted across multiple market cycles and economic conditions, though analysts caution that past performance does not guarantee future results.
Precious Metals Outperform
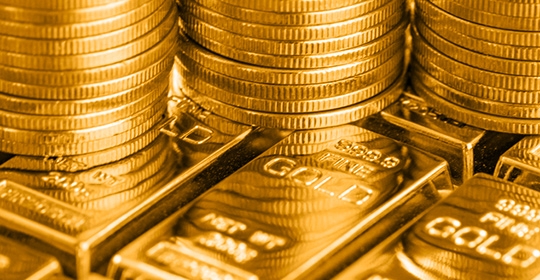
While equities showed minimal movement, precious metals continued their upward trajectory, with silver prices rising more than 4.5% to $74.88 per ounce and gold increasing by 1.1%. This divergence highlights how different asset classes can perform independently, particularly during periods of thin equity trading. The strength in precious metals reflects several underlying factors, including ongoing investor interest in safe-haven assets outside traditional stocks and bonds. Silver has experienced particularly strong gains due to supply constraints in the mining sector, while gold has benefited from expectations that the U.S. Federal Reserve will implement further interest rate cuts in the new year.
The relationship between interest rates and gold prices is particularly noteworthy, as expectations of rate cuts typically weaken the U.S. dollar against other currencies, making dollar-denominated gold more attractive to international buyers. This dynamic has fueled sustained buying interest in gold throughout the latter part of the year. Mining companies like Freeport-McMoRan were among the biggest gainers on Friday, benefiting directly from the rising prices of the metals they extract and process.
Broader Market Context and Individual Movers
The current market environment follows a remarkably strong year for equities, with the S&P 500 climbing nearly 18% since the start of 2025. This performance has been supported by several factors, including deregulatory policies from the Trump administration and widespread optimism about artificial intelligence's potential to boost corporate profitability across multiple sectors. The combination of policy support and technological optimism has created a favorable backdrop for equity investments throughout the year.
Among individual stocks, Target shares rose approximately 2% following a Financial Times report indicating that an activist investor was taking a stake in the retail giant. Such moves often generate speculation about potential strategic changes or operational improvements that could enhance shareholder value. In commodity markets, U.S. crude oil fell more than 1%, with Brent crude experiencing a similar decline, reflecting ongoing adjustments in energy markets. International trading was limited, with markets in Hong Kong, Australia, New Zealand, and Indonesia closed for holidays, while most European markets also remained shuttered on Friday.
Conclusion and Market Outlook
The quiet trading session following Christmas represents both a typical post-holiday pattern and the beginning of a historically significant period for equity markets. While the Santa Claus Rally has demonstrated statistical significance over decades, investors should approach seasonal patterns with appropriate context and consideration of broader market fundamentals. The simultaneous strength in precious metals highlights how different asset classes can respond to varying economic signals and investor preferences.
As markets move into the final days of the year and prepare for the new year's opening sessions, investors will be watching for whether the historical Santa Claus Rally pattern manifests in the current market environment. The combination of thin trading volumes, seasonal patterns, and ongoing developments in monetary policy and corporate performance creates a complex backdrop for investment decisions as one year transitions to the next.